



Bitcoin surged past $85,000 as a wave of short liquidations accelerated the digital asset’s strongest advance since January.
Figures from CryptoSlate revealed that BTC climbed over 5% in a 24-hour window to hit $85,193, building on a 35-day gain of roughly 29%. Following the breakthrough of levels that had hindered its recovery for the majority of the year, the cryptocurrency eased to $84,545 by press time.
This rapid upward movement left bearish traders heavily exposed. CoinGlass metrics showed that approximately $750.5 million in leveraged crypto positions were wiped out within 24 hours, with more than $648 million—about 86%—originating from short bets. In total, roughly 137,386 traders faced liquidations during this timeframe.
Bitcoin accounted for roughly $360 million of these liquidations, while Ethereum contributed nearly $171 million. The largest single liquidation involved an $11.29 million BTC-USDT position on Binance.
The forced unwinding coincided with a sudden surge in aggressive buying across Bitcoin derivatives markets. According to CryptoQuant, net taker volume on Binance shot up from about $11 million to $618 million within a single hour as European trading commenced, pointing to a swift imbalance toward market buyers.
CryptoQuant pointed to improving geopolitical sentiment as a contributing factor, noting that investors reacted positively to indicators of potential diplomatic headway between the United States and Iran. Concurrently, oil prices retreated as markets evaluated the possibility of talks, reinforcing a broader return of risk appetite despite ongoing regional conflicts.
At the same time, high leverage amplified Bitcoin’s price trajectory. Total Bitcoin open interest sits near $28.83 billion, matching levels close to its May record and leaving a substantial pool of derivatives positions vulnerable to subsequent price fluctuations.
Such positioning can continue to benefit Bitcoin if prices climb further and additional short sellers are compelled to cover their positions. Conversely, it leaves the broader market vulnerable to a sharper downturn.
Should Bitcoin lose its momentum, leveraged long positions risk unraveling swiftly, converting the very mechanics that fueled the rally into a catalyst for heavy selling pressure.
Bitcoin clears long-termed bear-market markers
The push past $85,000 also carried Bitcoin through technical thresholds that traders had monitored for months as signs that the market downturn was concluding.
Last week, Bitcoin closed above its 50-week moving average for the first time since November 2025, wrapping up a 45-week duration spent under that benchmark. Alex Thorn, Galaxy Digital’s Head of Firmwide Research, noted that historical recoveries of this metric have frequently served as strong validation that Bitcoin had already put in its bear-market bottom.
This indicator is not infallible. Data from Galaxy research indicates that Bitcoin has previously reclaimed the 50-week average only to slide back underneath it, such as during the 2021-2022 bear market.
Ki Young Ju, Chief Executive of CryptoQuant, pointed out another closely tracked threshold after Bitcoin climbed back above its 365-day moving average near $83,000. He suggested that maintaining this level could entice momentum traders and institutional investors who stayed on the sidelines during the slump to re-enter the market.
Consequently, Bitcoin analyst Joe Consorti stated that the market was tentatively moving into a “bull market.”
Even so, the strength of the breakout has not yet triggered a matching surge in underlying network usage.
Blockchain analytics firm Santiment reported that new and active Bitcoin addresses stayed close to their median levels recorded between July 24 and Sept. 20, despite the higher prices. Social activity rose to 1.23 times its baseline while large transactions exceeding $100,000 increased to 1.18 times standard levels, though neither metric achieved a two-month high.
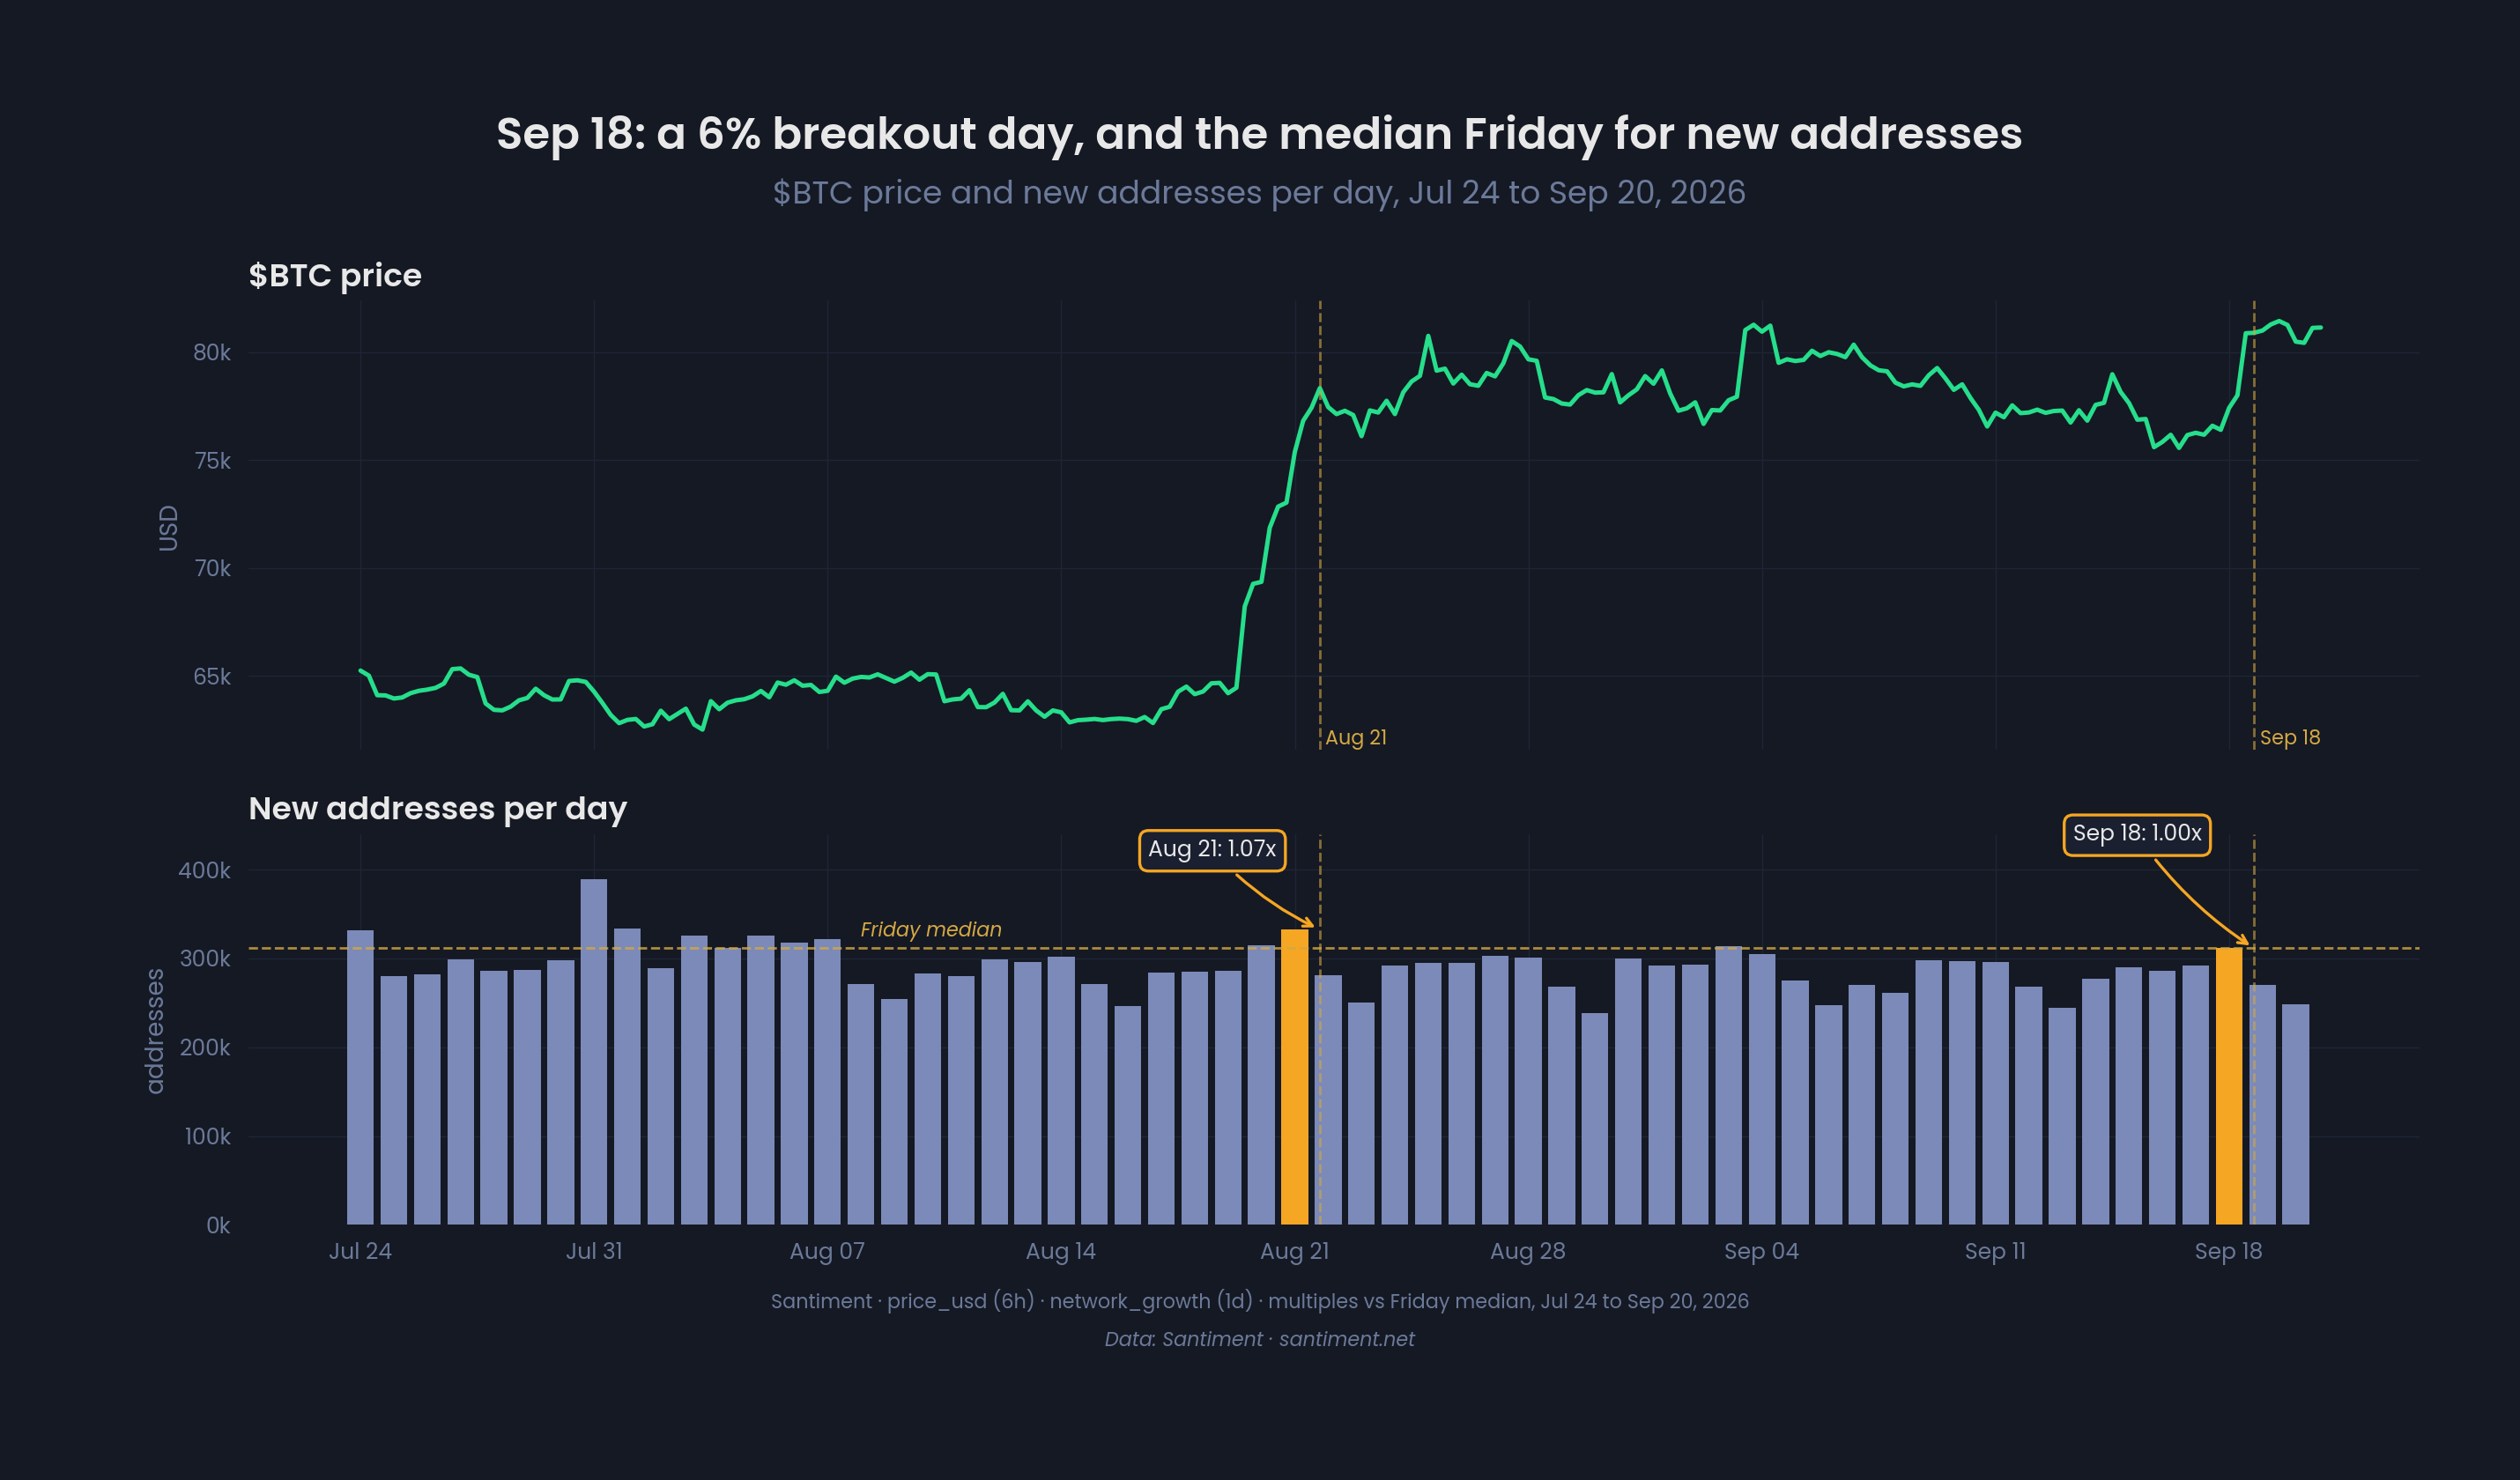
This contrasted with Bitcoin’s rally on Aug. 21, when the cryptocurrency gained nearly 7%. That event sparked greater wallet activity despite offering a less pronounced technical breakout, with new addresses hitting 1.07 times their baseline and active addresses rising to 1.14 times.
Santiment observed that 10 weekdays over the preceding two months generated a higher volume of new wallets than the Sept. 18 breakout session.
Conversely, derivatives activity remained significantly more robust. Open interest expanded by roughly 9% on Sept. 18 and has stayed elevated, highlighting the discrepancy between leveraged market participation and actual activity on the Bitcoin network.
This divergence means the rally’s sustainability relies heavily on whether new spot demand materializes. While forced buying driven by short liquidations can propel Bitcoin through resistance levels, its efficacy fades once bearish positions are cleared. Maintaining a price above $85,000 will necessitate fresh capital to take the place of traders forced to exit losing positions.
Frequently Asked Questions
- How high did Bitcoin surge during the recent rally? Bitcoin climbed above $85,000, reaching $85,193 before easing to $84,545 by press time.
- What caused the massive wave of liquidations? A rapid increase in prices caught bearish traders heavily exposed, resulting in $750.5 million in liquidated positions, of which over $648 million came from short positions.
- What technical milestone did Bitcoin clear? Bitcoin closed above its 50-week moving average for the first time since November 2025 and also moved back above its 365-day moving average near $83,000.
- Did underlying network activity match the price surge? No, Santiment reported that new and active Bitcoin addresses remained near their median levels, showing that derivatives activity outpaced on-chain network participation.